


VOL. 16, ISSUE NO. 6 | September 2023
Oversight
No letup in declining engineering exports
POLICY WONK
ENGINEERING EXPORTS
The monthly engineering figures for 2023-24 vis-à-vis 2022-23 are shown in Table1 as per the latest DGCI&S estimates
Top 25 engineering export destinations
We now look at the export scenario of the top 25 nations that had highest demand for Indian engineering products during July 2023 over July 2022 as well as in cumulative terms during April-July 2023-24 vis-à-vis April-July 2022-23. The data shows that the top 25 countries contribute more than 76 percent of total engineering exports
Table1: Engineering exports: Monthly trend in 2023-24 ($ million) |
|||
|---|---|---|---|
| Month | 2022-23 | 2023-24 | Growth (%) |
| April | 9677.95 | 8973.28 | -7.28 |
| May | 9713.43 | 9312.03 | -4.13 |
| June | 9581.22 | 8532.22 | -10.95 |
| April-June | 28972.60 | 26817.53 | -7.44 |
| July | 9367.92 | 8747.76 | -6.62 |
| April-July | 38340.52 | 35565.29 | -7.24 |
Engineering exports started fiscal 2023-24 with 7.15% y-o-y decline in April 2023
Trade flow |
Export figures ($ billion) |
% growth |
||||
|---|---|---|---|---|---|---|
| July 2022 | July 2023 | Apr-Jul 22-23 | Apr-Jul 2023-24 | Jul-23 over Jul-22 | Apr-Jul 23-24 over Apr-Jul 22-23 | |
| Engineering exports | 9.37 | 8.75 | 38.34 | 35.57 | -6.62 | -7.24 |
| Overall exports | 38.33 | 32.25 | 159.32 | 136.22 | -15.86 | -14.50 |
| Share of engineering % | 24.44 | 27.12 | 24.07 | 26.11 | --- | --- |
| Service exports | 24.26 | 27.17 | 100.35 | 107.93 | 12.00 | 7.55 |
Source: Compiled from data by DGCI&S and Quick Estimates published by the GoI
India’s engineering exports continued to decline for the fourth month in fiscal 2023-24 as it dropped by 6.62 percent to $8.75 billion in July 2023 from $9.37 billion in July 2022. The decline was mainly due to drop in exports of iron and steel and aluminium coupled with falling global demand due to recession-like situation in major developed regions. Export also dropped in India’s major destinations including North America, EU, ASEAN, and the South Asian region. According to the Quick Estimates of the Union Department of Commerce, the share of engineering exports in India’s total merchandise exports was 24.26 percent during July 2023 and 26.11 percent during April-July 2023-24
- The month of July 2023 saw the fourth straight month of decline in engineering exports during the ongoing fiscal but the pace of decline moderated to single digit once again from a double-digit y-o-y decline in June 2023. Engineering exports from India conceded y-o-y decline for the eighth month in a row starting from December 2022.
- During July 2023, engineering exports dropped by 6.62 percent to $8747.76 million from $9367.92 million in July 2022.
- Cumulative engineering exports declined by 7.24 percent to $35,565.29 million during April-July 2023-24 from $38,340.52 million during the same period last fiscal.
- According to the Quick Estimates of the Union Department of Commerce, the share of engineering exports in India’s total merchandise exports was 24.26 percent during July 2023 and 26.11 percent during April-July 2023-24.
- 14 out of 34 engineering panels witnessed positive y-o-y growth in July 2023, while the remaining 20 panels witnessed negative growth in exports. Major engineering products like iron and steel, products of iron and steel, most of the non-ferrous products including aluminium, zinc, tin products barring copper, nickel and lead, industrial machinery and parts, two- and three-wheelers, auto components and parts, auto tyres, railway transport, hand tools, and mica products witnessed decline in exports during July 2023 vis-à-vis July 2022.
- On cumulative terms, 16 out of 34 engineering panels recorded positive growth during April-July 2023-24 over the same period last fiscal. Engineering panels that witnessed growth in exports include copper and products, pumps, lead and products, machine tools, aircraft and spacecraft, electrical machinery and equipment, auto components/parts, medical device and instruments, and other construction machinery. Major decline was witnessed in 18 engineering panels including iron and steel segment, aluminium, zinc, nickel, tin from non-ferrous segment, machinery for diary, motor vehicles and two- and three-wheelers, railway transport, bicycle parts, ship and floating structure, and hand tools.
- Region-wise, positive y-o-y growth in July 2023 was noted majorly in CIS, WANA, and NE Asia. Regions witnessing drop in exports during July 2023 include North America, ASEAN countries, EU countries, Sub-Saharan Africa, South Asia, Latin America, and Oceania.
- Country-wise, few top exporting destinations that witnessed positive growth during July 2023 were Germany (2), Saudi Arabia (73.7), South Korea (2.9), and Nepal (7) percent respectively while top destinations with negative export during the same period include USA (-10.4), UAE (-12.1), Italy (-1.9), Indonesia (-17.3), UK (-1.8), and Mexico (-6.8) percent, respectively.
Overall engineering exports vs engineering exports excluding steel segment ($ million) |
||||||
|---|---|---|---|---|---|---|
| Trade flow | Exports in July 2022 | Exports in July 2023 | Growth % | Exports in Apr-Jul 22-23 | Exports in Apr-Jul 23-24 | Growth % |
| Overall engineering exports | 9367.92 | 8747.76 | -6.62 | 38340.52 | 35565.29 | -7.24 |
| Engineering exports excluding iron and steel | 8324.23 | 7753.66 | 6.85 | 32260.01 | 31067.24 | -3.70 |
Source: DGCI&S, Govt. of India
Excluding the export of iron and steel, engineering exports recorded a higher 6.85 percent y-o-y decline in July 2023 but a much lower 3.7 percent decline during April-July 2023-24. This shows that steel plays spoilsport in the fall of engineering exports only on a cumulative basis.
Table2: Engineering exports country-wise ($ million) |
||||||
|---|---|---|---|---|---|---|
| Country | July 2022 | July 2023 | Growth % | Apr-Jul 22-23 | Apr-Jul 23-24 | Growth % |
| USA | 1615.79 | 1447.34 | -10.4 | 6938.59 | 5751.91 | -17.1 |
| UAE | 435.41 | 382.89 | -12.1 | 1659.85 | 1823.90 | 9.9 |
| Italy | 308.37 | 302.52 | -1.9 | 1622.37 | 1459.14 | -10.1 |
| Germany | 339.42 | 346.36 | 2.0 | 1320.99 | 1384.52 | 4.8 |
| Saudi Arabia | 217.42 | 377.63 | 73.7 | 877.69 | 1365.72 | 55.6 |
| UK | 391.18 | 384.32 | -1.8 | 1238.88 | 1223.77 | -1.2 |
| Singapore | 305.28 | 211.22 | -30.8 | 1373.90 | 1136.12 | -17.3 |
| Indonesia | 182.81 | 151.20 | -17.3 | 949.96 | 1113.98 | 17.3 |
| Mexico | 303.95 | 283.34 | -6.8 | 1258.33 | 1101.07 | -12.5 |
| South Korea | 248.49 | 255.65 | 2.9 | 878.26 | 1017.06 | 15.8 |
| Turkey | 265.00 | 231.22 | -12.7 | 950.01 | 924.95 | -2.6 |
| Nepal | 183.45 | 196.23 | 7.0 | 868.35 | 814.01 | -6.3 |
| Bangladesh | 232.37 | 174.34 | -25.0 | 1064.10 | 764.79 | -28.1 |
| China | 220.84 | 197.98 | -10.4 | 883.25 | 758.74 | -14.1 |
| South Africa | 208.52 | 224.73 | 7.8 | 803.78 | 754.34 | -6.2 |
| Netherlands | 170.64 | 157.47 | -7.7 | 935.76 | 712.80 | -23.8 |
| France | 218.86 | 173.67 | -20.6 | 710.81 | 692.39 | -2.6 |
| Brazil | 165.31 | 171.64 | 3.8 | 621.72 | 669.92 | 7.8 |
| Thailand | 218.08 | 154.09 | -29.3 | 801.35 | 590.74 | -26.3 |
| Japan | 125.17 | 142.46 | 13.8 | 564.10 | 589.39 | 4.5 |
| Spain | 80.7 | 132.22 | 65.1 | 550.24 | 568.09 | 3.2 |
| Belgium | 124.18 | 136.32 | 9.8 | 843.59 | 559.49 | -33.7 |
| Malaysia | 112.27 | 211.61 | 88.5 | 553.76 | 537.73 | -2.9 |
| Russia | 55.65 | 123.65 | 122.2 | 145.33 | 461.35 | 217.5 |
| Australia | 122.15 | 115.14 | -5.7 | 428.32 | 454.02 | 6.0 |
| Total engineering exports to top 25 countries | 6850.67 | 6685.25 | -2.4 | 28843.26 | 27229.94 | -5.6 |
| Total engineering exports | 9367.92 | 8747.76 | -6.6 | 38340.52 | 35565.29 | -7.2 |
| Share % of top 25 destinations | 73.1 | 76.4 | 75.2 | 76.6 | ||
Source: DGCI&S
Table3: Region-wise engineering exports, April-July 2023-24 vs April-July 2022-23 ($ million) |
||||||
|---|---|---|---|---|---|---|
| Region | July 2022 | July 2023 | Growth % | Apr-Jul 22-23 | Apr-Jul 23-24 | Growth % |
| North America | 2071.62 | 1835.15 | -11.4 | 8779.41 | 7249.56 | -17.4 |
| European Union | 1642.53 | 1590.63 | -3.2 | 7576.58 | 6943.93 | -8.4 |
| WANA | 1019.31 | 1113.02 | 9.2 | 4166.59 | 4796.98 | 15.1 |
| ASEAN | 1029.50 | 897.35 | -12.8 | 4579.99 | 4046.40 | -11.7 |
| NE Asia | 679.91 | 682.54 | 0.4 | 2662.60 | 2666.70 | 0.2 |
| SSA (Sub-Saharan Africa) | 786.07 | 738.93 | -6.0 | 2980.65 | 2618.46 | 12.2 |
| Other Europe | 682.84 | 649.10 | -4.9 | 2336.08 | 2293.24 | -1.8 |
| South Asia | 760.84 | 478.22 | -37.1 | 2548.39 | 1974.81 | -22.5 |
| Latin America | 494.82 | 485.16 | -2.0 | 2025.28 | 1915.60 | -5.4 |
| CIS | 67.27 | 149.52 | 122.3 | 198.12 | 561.81 | 183.6 |
| Oceania | 131.86 | 125.57 | -4.8 | 475.29 | 488.90 | 2.9 |
| Others | 1.35 | 2.56 | 89.4 | 11.56 | 8.91 | -22.9 |
| Grand total | 9367.92 | 8747.76 | -6.6 | 38340.52 | 35565.29 | -7.2 |
Note: *Myanmar has been included in ASEAN and not in South Asia, since ASEAN is a formal economic grouping
Product panel-wise engineering exports
We begin by looking at the engineering panel-wise exports for the month of July 2023 vis-à-vis July 2022 as well as the cumulative exports for April-July 2023-24 vis-à-vis April-July 2022-23. These are indicated in Tables4a-g.
Engineering product panels – country-wise analysis
some of the important products for fiscal April-July 2023-24 vis-à-vis April-July 2022-23. We have taken the major panels and computed the top importers to get an idea of the current trade pattern. (Table5)
Note: *Myanmar has been included in ASEAN and not in South Asia, since ASEAN is a formal economic grouping
Table4a: Trend in exports of iron and steel and its products ($ million) |
||||||
|---|---|---|---|---|---|---|
| Product panel | July 2022 | July 2023 | Growth % | Apr-Jul 2022-23 | Apr-Jul 23-24 | Growth % |
| Iron and steel | 1043.7 | 994.1 | -5 | 6080.5 | 4498.1 | -26 |
| Products of iron and steel | 864.2 | 811.7 | -6 | 3341.2 | 3168.3 | -5 |
| Subtotal | 1907.9 | 1805.8 | -5 | 9421.7 | 7666.3 | -19 |
Source: DGCI&S
Table4b: Trend in exports of non-ferrous metals and products ($ million) |
||||||
|---|---|---|---|---|---|---|
| Product panel | July 2022 | July 2023 | Growth % | Apr-Jul 2022-23 | Apr-Jul 23-24 | Growth % |
| Copper and products | 137.6 | 178.6 | 30 | 556.2 | 713.7 | 28 |
| Aluminium and products | 694.8 | 589.0 | -15 | 3294.6 | 2453.6 | -26 |
| Zinc and products | 116.3 | 52.2 | -55 | 551.4 | 293.5 | -47 |
| Nickel and products | 10.0 | 13.4 | 34 | 95.0 | 59.5 | -37 |
| Lead and products | 26.2 | 42.8 | 63 | 155.3 | 171.0 | 10 |
| Tin and products | 1.8 | 1.6 | -11 | 5.0 | 4.0 | -20 |
| Other non-ferrous metals | 68.5 | 63.4 | -7 | 267.0 | 239.2 | -10 |
| Subtotal | 1055.3 | 941.1 | -11 | 4924.4 | 3934.5 | -20 |
Source: DGCI&S
Table4c: Trend in exports of industrial machinery ($ million) |
||||||
|---|---|---|---|---|---|---|
| Product panel | July 2022 | July 2023 | Growth % | Apr-Jul 2022-23 | Apr-Jul 23-24 | Growth % |
| Industrial machinery like boilers, parts, etc. | 73.1 | 60.0 | -18 | 242.6 | 247.3 | 2 |
| IC engines and parts | 351.9 | 323.2 | -8 | 1236.5 | 1192.3 | -4 |
| Pumps of all types | 107.1 | 125.3 | 17 | 424.7 | 479.7 | 13 |
| Air condition and refrigerators | 139.2 | 126.2 | -9 | 549.3 | 541.9 | -1 |
| Industrial machinery for dairy, food processing, textiles etc. | 731.5 | 687.6 | -6 | 2952.1 | 2607.8 | -12 |
| Machine tools | 64.5 | 58.1 | -10 | 239.4 | 241.7 | 1 |
| Machinery for injecting moulding, valves and ATMs | 202.3 | 207.7 | 3 | 727.8 | 813.5 | 12 |
| Subtotal | 1669.7 | 1588.1 | -5 | 6372.3 | 6124.3 | -4 |
Source: DGCI&S
Table4d: Trend in exports of electrical machinery and equipment ($ million) |
||||||
|---|---|---|---|---|---|---|
| Product panel | July 2022 | July 2023 | Growth % | Apr-Jul 2022-23 | Apr-Jul 23-24 | Growth % |
| Electrical machinery | 921.5 | 1092.9 | 19 | 3700.2 | 3982.9 | 8 |
Source: DGCI&S
Table4e: Trend in exports of auto and auto parts ($ million) |
||||||
|---|---|---|---|---|---|---|
| Product panel | July 2022 | July 2023 | Growth % | Apr-Jul 2022-23 | Apr-Jul 23-24 | Growth % |
| Motor vehicle/cars | 687.2 | 734.3 | 7 | 2833.2 | 2771.8 | -2 |
| Two- and three-wheelers | 270.5 | 239.1 | -12 | 1062.6 | 881.8 | -17 |
| Auto components/part | 650.2 | 648.3 | 0 | 2410.3 | 2464.1 | 2 |
| Auto tyres and tubes | 281.8 | 231.5 | -18 | 1107.2 | 902.0 | -19 |
| Subtotal | 1889.8 | 1853.2 | -2 | 7413.3 | 7019.7 | -5 |
Source: DGCI&S
Table4f: Trend in exports of aircraft, spacecraft and parts and ships, boats and floating structures ($ million) |
||||||
|---|---|---|---|---|---|---|
| Product panel | July 2022 | July 2023 | Growth % | Apr-Jul 2022-23 | Apr-Jul 23-24 | Growth % |
| Aircraft, spacecraft parts and products | 114.6 | 135.4 | 18 | 450.9 | 501.8 | 11 |
| Ships, boats, floating products, parts | 634.7 | 119.9 | -81 | 1671.1 | 1604.8 | -4 |
Source: DGCI&S
Table4g: Trend in exports of other engineering products ($ million) |
||||||
|---|---|---|---|---|---|---|
| Product panel | July 2022 | July 2023 | Growth % | Apr-Jul 2022-23 | Apr-Jul 23-24 | Growth % |
| Medical and scientific instruments | 183.1 | 195.4 | 7 | 695.1 | 808.6 | 16 |
| Railway transport | 28.1 | 26.2 | -7 | 135.7 | 100.7 | -26 |
| Hand tools and cutting tools | 90.0 | 80.0 | -11 | 337.5 | 303.7 | -10 |
| Bicycle and parts | 31.1 | 31.0 | 0 | 135.3 | 119.2 | -12 |
| Cranes lifts and winches | 75.4 | 76.1 | 1 | 257.0 | 283.5 | 10 |
| Office equipment | 26.4 | 27.9 | 6 | 83.3 | 110.9 | 33 |
| Other construction machinery | 213.4 | 252.9 | 18 | 760.2 | 933.5 | 23 |
| Prime mica and mica products | 2.9 | 2.4 | -17 | 10.8 | 13.0 | 21 |
| Project goods | 0.18 | 0.19 | 8 | 0.72 | 1.25 | 75 |
| Other rubber products except footwear | 170.0 | 140.9 | -17 | 593.5 | 541.9 | -9 |
| Other misc. items | 353.8 | 378.5 | 7 | 1377.5 | 1514.6 | 10 |
Source: DGCI&S
Table5: Export of different panels ($ million) |
||||||
|---|---|---|---|---|---|---|
| Product panels | Top 5 nations | April-July 22-23 | April-July 23-24 | Growth (%) | ||
| Iron and Steel | ITALY | 864.7 | 720.6 | -17 | ||
| Nepal | 344.4 | 348.1 | 1 | |||
| UAE | 461.0 | 249.1 | -46 | |||
| Belgium | 409.3 | 222.7 | -46 | |||
| Spain | 176.9 | 221.1 | 25 | |||
| Products of Iron and Steel | USA | 1091.3 | 910.2 | -17 | ||
| UAE | 135.7 | 168.6 | 24 | |||
| Germany | 169.0 | 148.0 | -12 | |||
| Saudi Arabia | 85.2 | 147.1 | 73 | |||
| UK | 118.0 | 109.5 | -7 | |||
| Industrial Machinery | USA | 1308.6 | 1216.7 | -7 | ||
| Germany | 322.3 | 346.6 | 8 | |||
| Thailand | 379.3 | 256.4 | -32 | |||
| UAE | 235.2 | 254.3 | 8 | |||
| China | 287.2 | 242.2 | -16 | |||
| Automobiles (Motor Vehicles/Cars and Two and Three Wheelers) | Saudi Arabia | 256.4 | 455.6 | 78 | ||
| South Africa | 484.4 | 435.8 | -10 | |||
| Mexico | 394.8 | 390.9 | -1 | |||
| Indonesia | 119.1 | 202.6 | 70 | |||
| UAE | 156.6 | 167.7 | 7 | |||
| Non-Ferrous metals | Korea | 513.7 | 503.7 | -2 | ||
| USA | 577.1 | 470.1 | -19 | |||
| Saudi Arabia | 92.6 | 356.0 | 285 | |||
| Malaysia | 267.3 | 291.0 | 9 | |||
| Netherlands | 371.8 | 154.0 | -59 | |||
| Electrical Machinery and Components | USA | 1103.2 | 794.6 | -28 | ||
| UK | 220.3 | 326.3 | 48 | |||
| Singapore | 140.0 | 317.0 | 126 | |||
| GERMANY | 180.3 | 235.2 | 30 | |||
| France | 225.0 | 208.7 | -7 | |||
| Aircrafts and Space crafts | USA | 153.9 | 148.6 | -3 | ||
| FRANCE | 68.3 | 70.0 | 2 | |||
| UK | 35.5 | 40.1 | 13 | |||
| Singapore | 60.0 | 33.3 | -45 | |||
| Turkey | 7.1 | 31.5 | 347 | |||
| Ships, Boats and Floating Structures and parts | SINGAPORE | 661.8 | 426.7 | -36 | ||
| UAE | 135.9 | 410.4 | 202 | |||
| Indonesia | 289.1 | 401.5 | 39 | |||
| 163.8 | 0.0 | 163.8 | ||||
| Sri Lanka | 237.9 | 67.7 | -72 | |||
| Auto Components( including Auto Parts and Auto Tyre) | USA | 878.5 | 760.3 | -13 | ||
| Germany | 174.9 | 176.6 | 1 | |||
| Turkey | 128.0 | 171.4 | 34 | |||
| Brazil | 194.8 | 168.8 | -13 | |||
| Mexico | 134.2 | 151.5 | 13 | |||
Source: DGCI&S
Table6:Top state-wise engineering export performance –April-June2023-24 ($ million) |
|||||
|---|---|---|---|---|---|
| Top state | Cumulative exports Apr-Jun 22-23 | Cumulative exports Apr-Jun 23-24 | Growth % vis-à-vis Apr-Jun 22-23 | % share engg exports Apr-Jun 23-24 | Remark |
| Maharashtra | 5573.7 | 5845.3 | 5 | 21.8 | 90.21 % share covered by top 12 states |
| Tamil Nadu | 4364.5 | 3969.7 | -9 | 14.8 | |
| Gujarat | 3373.2 | 3361.8 | 0 | 12.5 | |
| Odisha | 2679.5 | 1821.4 | -32 | 6.8 | |
| Karnataka | 1595.9 | 1690.7 | 6 | 6.3 | |
| Haryana | 1583.0 | 1690.2 | 7 | 6.3 | |
| Andhra Pradesh | 1685.7 | 1542.4 | -8 | 5.8 | |
| Uttar Pradesh | 1299.4 | 1049.4 | -19 | 3.9 | |
| Delhi | 778.3 | 936.6 | 20 | 3.5 | |
| West Bengal | 1092.9 | 830.5 | -24 | 3.1 | |
| Rajasthan | 920.1 | 806.4 | -12 | 3.0 | |
| Punjab | 675.1 | 642.0 | -5 | 2.4 | |
Source: DGCI&S
Table7: Region-wise exports from India ($ million) |
||||||
|---|---|---|---|---|---|---|
| Region | June 2022 | June 2023 | Growth% | Total exports Apr-Jun 2022-23 | Total exports Apr-Jun 2023-24 | Growth% |
| Eastern | 1424.6 | 1016.0 | -28.7 | 4693.7 | 3221.1 | -31.4 |
| Northern | 1745.5 | 1676.2 | -4.0 | 5495.1 | 5531.7 | 0.7 |
| Southern | 2837.8 | 2472.4 | -12.9 | 8297.2 | 7934.0 | -4.4 |
| Western | 3187.9 | 3351.7 | 5.1 | 9826.8 | 10125.2 | 3.0 |
| Total | 9195.7 | 8516.3 | -7.4 | 28312.7 | 26811.9 | -5.3 |
Note: The total engineering exports given in the table is taken from NIRYAT and may not tally with the total engineering exports as given by DGCI&S
Source: NIRYAT portal
Engineering product panels – some observations
- Italy, Nepal, and UAE were the top three importers of Indian iron and steel during April-July 2023-24 while USA, UAE, and Germany were the top three importers of India’s products of iron and steel during the same period as compared to April-July 2022-23.
- USA was the largest importer of Indian industrial machinery constituting 20 percent share in India’s total global exports of the product during April-July 2023-24. Germany and Thailand were the two immediate followers constituting 6 and 4 percent share respectively in terms of India’s total global exports of industrial machinery.
Figure2: India’s projected target exports to Australia ($ billion)
- Saudi Arabia, South Africa, and Mexico were the top three importers of India’s automobiles during April-July 2023-24 in India’s global exports respectively over the same period last fiscal.
- South Korea, USA, and Saudi Arabia were the top three importers of India’s non-ferrous metals and products during April-July 2023-24 while USA, UK and Singapore were the three top importers of Indian Electrical Machinery and Components during the same period.
- USA, France and UK were the top three importers of India’s ‘Aircrafts and Spacecrafts’ during April-July 2023-24 in India’s total global exports of the product followed by Singapore and Turkey.
- Singapore, UAE and Indonesia became the largest importer of ships, boats and floating structures followed by Oman and Sri Lanka. While for the auto components’ product group, USA remained the top importer in April-July 2023-24 followed by Germany, Turkey and Brazil.
ENGINEERING EXPORTS – STATE-WISE ANALYSIS
Table6 indicates the exports from top Indian states. It is evident from the table that almost 90.2 percent of India’s exports is contributed by the listed 12 states. Within this almost 49 percent of exports is done by Maharashtra, Tamil Nadu, and Gujarat together.
State-wise engineering exports – some observations
- Top 12 states constitute over 90.22 percent of India’s engineering exports.
- Major negative growth witnessed in states like Tamil Nadu, Odisha, Andhra Pradesh, Uttar Pradesh, West Bengal, Rajasthan, Punjab, Madhya Pradesh, during April-June 2023-24 compared to the same period last fiscal.
- Maharashtra being the top state in terms of engineering goods exports is leading by $1.9 billion from Tamil Nadu (second-highest) for the period April-June 2023.
India’s region-wise engineering exports
In terms of region, Western region, which includes industrial states like Maharashtra and Gujarat, is the frontrunner in terms of exports with 34.3 percent share. Tamil Nadu from the Southern Region has improved its export performance and it ranked second after Maharashtra.
Correlation between manufacturing production and engineering exports
The engineering sector is an important component of the broader manufacturing sector and the share of engineering production in overall manufacturing output is quite significant. As exports generally come from what is produced within a country, some correlation between manufacturing production growth and engineering export growth should exist. We briefly looked at the trend in manufacturing growth as also engineering exports growth to see if they move in tandem. It may be mentioned that manufacturing has 77.63 percent weightage in India’s industrial production.
Engineering exports growth and manufacturing output growth moved in the same direction in as many as nine out of 12 months in each of the fiscal years 2019-20 and 2020-21. During fiscal 2021-22, engineering exports growth and manufacturing growth moved in the same direction in seven out of 12 months while in fiscal 2022-23, as many as 10 out of 12 months saw engineering exports and manufacturing output moving in the same direction.
The first three months of fiscal 2023-23 saw engineering exports growth and revised manufacturing output growth moving in the same direction. During April and May 2023, the former witnessed slower decline and the later showed higher growth while in June 2023, engineering exports conceded higher decline and manufacturing output growth slowed down.
The link between these two may not be established on a monthly basis, but a positive correlation may be seen if the medium- to long-term trend is considered.
Impact of exchange rate on India’s exports
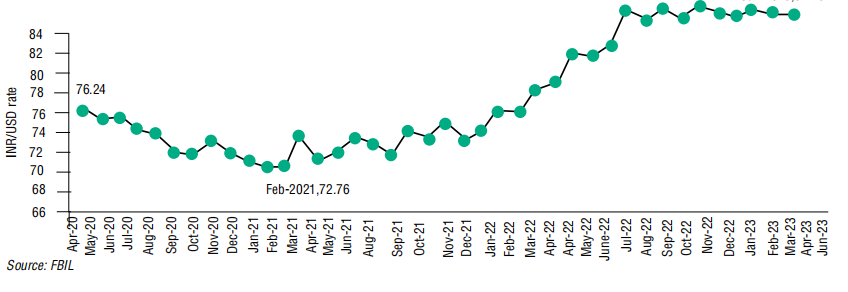
How did the exchange rate fare during June 2023 and what was the recent trend in the rupee-dollar movement? In order to get a clearer picture of the recent trend, we not only took the exchange rate of July 2023, but also considered the monthly average exchange rate of the rupee vis-à-vis the dollar for each month of fiscal 2022-23 as well as 2021-22 as mere one-month figure does not reflect any trend. Table9 depicts the short-term trend:
Depreciation of the rupee vis-à-vis the dollar continued on a y-o-y basis during July 2023 following the strengthening of the latter in the international market as the rupee depreciated by 3.2 percent during July 2023. However, the rupee strengthened over the month for the second time in a row with 0.1 percent appreciation. The rupee may recover going forward in 2023 as inflows in equity and debt are expected due to economic slowdown and apprehended recession in major developed regions.
ENGINEERING IMPORTS
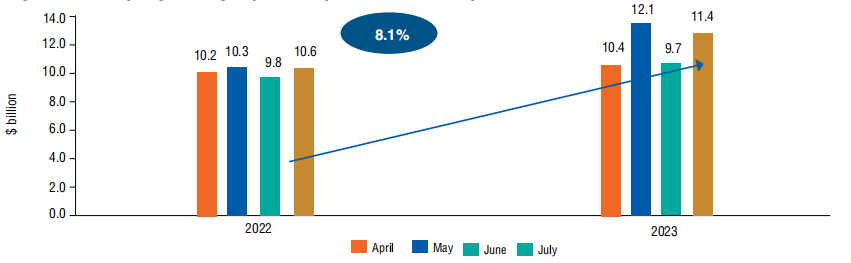
India’s engineering imports during July 2023 were valued at $11,417.7 million compared to $10,560.9 million in July 2022, recording positive growth of 8.1 percent in dollar terms. All the engineering panels witnessed an increase in imports during July 2023 compared to July 2022.
The share of engineering imports in India’s total merchandise imports in July 2023 was estimated at 21.6 percent, higher than that of July 2022, which was estimated at 16.6 percent. Figure3 depicts engineering imports for July 2023 compared to July 2022.
Figure3: Monthly engineering imports, May 2023 vis-à-vis May 2022
Source: EEPC India analysis
TREND IN ENGINEERING TRADE BALANCE
We now present the trend in two-way yearly trade for the engineering sector for fiscal 2023-24 depicted in Table11.
Table11: Monthly trend in engineering trade balance, FY 2023-24 ($ billion) |
||||
|---|---|---|---|---|
| Trade flow | April | May | June | July |
| Engineering exports | 9.0 | 9.3 | 8.5 | 8.7 |
| Engineering imports | 10.4 | 12.1 | 9.7 | 11.4 |
| Trade balance | -1.4 | -2.8 | -1.2 | -2.7 |
Source: DGCI&S, EEPC India Analysis
Conclusion
Eight consecutive months of y-o-y decline in engineering exports since December 2022 necessarily implies a depressing scenario of global trade, especially of engineering. Our analysis shows that the decline is mostly due to the metal sector – iron and steel and aluminium in particular, the two major components of engineering exports from India. According to global news sources, global demand for steel weakened with prominent demand crisis arising from slowdown in China’s construction sector. At the same time excess supply from China has been creating downward pressure on steel prices. Similar concerns including the banking crisis in US have also affected the demand and price of copper, aluminium, lead, and zinc. Slackening of demand from overseas is also witnessed especially from developed regions including India’s major exporting destinations for engineering products partners namely the USA, EU countries, and China. Debt crises have also led to decline in exports to South Asia.
According to a report by UNCTAD, global trade scenario is apprehended to remain pessimistic in the second half of 2023 owing to several negativities like geopolitical crisis in Russia-Ukraine region, slowdown in developed economies that may turn to recession in some nations due to persistent inflationary pressure, debt crisis and partial slowdown in Northeast Asia centring China. The situation may worsen further with the implementation of CBAM regulations by the EU. In such a situation it is important for India to diversify its markets. It is an opportunity for India to diversify especially to non-traditional markets of Africa and Latin America. This can be done by pursuing comprehensive FTAs in these regions. As the two new FTAs with UAE and Australia led to increase in exports to both, more comprehensive FTAs with potential partners would be a right step for India to achieve its goal of $2 trillion exports by 2030.
© Copyright 2023, All rights reserved. Design by Andreal